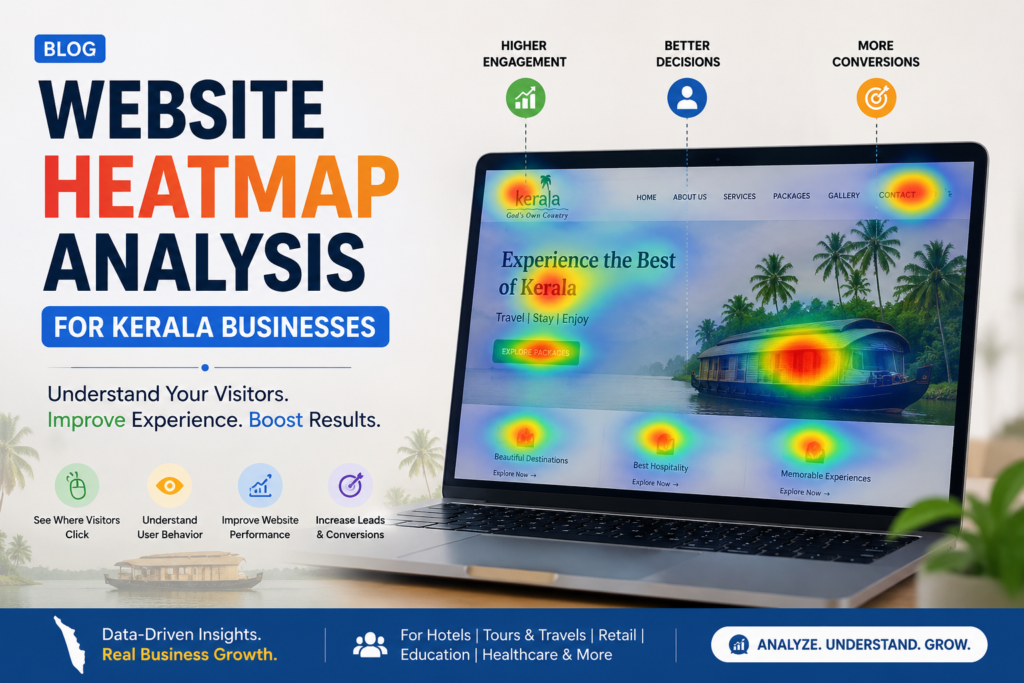
Website Heatmap Analysis for Kerala Businesses: What Your Visitors Are Really Doing
Website heatmap analysis for Kerala businesses is no longer an optional digital marketing tactic — it is a necessity. Whether you run a tourism agency in Kochi, a textile store in Thrissur, or a SaaS startup targeting global clients from Thiruvananthapuram, understanding exactly how your website visitors behave is the difference between a site that converts and one that bleeds traffic silently.
Kerala’s digital economy is growing at a remarkable pace. With over 54% internet penetration and a highly literate population that actively shops, researches, and books services online, the stakes for website performance have never been higher. Yet most Kerala business owners still rely only on basic Google Analytics metrics — page views, bounce rates, and session durations — without ever asking the deeper question: Where exactly are my visitors looking, clicking, and leaving?
That is precisely what heatmaps answer.
What Is a Website Heatmap and Why Does It Matter?
A heatmap is a visual data tool that uses color gradients — red for high activity, blue for low activity — to show how users interact with your webpages. It records clicks, scrolls, mouse movements, and attention zones, giving you a visual story of user behavior that numbers alone cannot tell.
For Kerala businesses, this matters enormously. A visitor from Kozhikode browsing a local jewellery site behaves differently from an NRI visitor in Dubai shopping for the same product. A student in Kannur researching college admissions interacts with content differently than a foreign tourist planning a backwater tour. Heatmaps capture all of these behavioral differences in one visual layer.
There are three primary types of heatmaps every website owner should know:
Click Heatmaps Click heatmap analysis for Malayalam websites reveals which buttons, images, links, and text elements users are actually clicking. Many Kerala websites discover that visitors are clicking on non-linked images expecting them to be interactive — a simple fix that dramatically improves user experience.
Scroll Maps Scroll map insights for Kerala business landing pages show how far down a page visitors actually scroll before leaving. If your most important offer, contact form, or call-to-action sits below the 60% scroll depth, most visitors will never see it.
Move Maps Move maps track cursor movement, which closely correlates to eye movement. These maps reveal what content your visitors are reading most carefully — critical intelligence for content optimization.
How to Track Website Visitor Behavior in Kerala
How to track website visitor behavior in Kerala starts with choosing the right heatmap tool and installing it correctly on your website. The process is simpler than most business owners imagine.
The most widely used platforms include Hotjar, Crazy Egg, Microsoft Clarity, and Mouseflow. Microsoft Clarity is completely free and integrates directly with Google Analytics 4, making it an excellent starting point for small Kerala businesses.
Hotjar Setup Guide for Kerala Website Owners
The Hotjar setup guide for Kerala website owners is straightforward:
Step 1 — Create a free Hotjar account at hotjar.com and add your website URL. Step 2 — Copy the Hotjar tracking code snippet provided in your dashboard. Step 3 — Paste this code into the header section of your website, just before the closing head tag. Step 4 — If you use WordPress, install the official Hotjar plugin and enter your Site ID. Step 5 — Verify the installation using Hotjar’s built-in verification tool. Step 6 — Set up heatmaps on your highest-traffic pages — homepage, service pages, and landing pages first.
Within 24 to 48 hours, you will begin seeing real behavioral data from your Kerala website visitors.
Best Heatmap Tools for Kerala Digital Marketers
Choosing the right tool depends on your budget, technical capability, and the depth of analysis you need. Here is a practical breakdown:
Best heatmap tools for Kerala digital marketers include:
Microsoft Clarity — Best free option. Offers click maps, scroll maps, session recordings, and rage-click detection. Ideal for startups and small businesses.
Hotjar — Industry standard for mid-sized businesses. Excellent for combining heatmaps with user surveys and session recordings. Paid plans start affordably.
Crazy Egg — Strong A/B testing integration alongside heatmaps. Best for Kerala businesses actively running conversion optimization experiments.
Mouseflow — Best for user behavior analytics for Kerala e-commerce websites, offering funnel analysis, form analytics, and friction detection alongside heatmap data.
Each of these tools helps you move beyond guesswork and make design, content, and UX decisions backed by actual visitor behavior.
What Kerala Visitor Behavior Data Actually Reveals
Local business website optimization Kerala using behavior data begins when you start reading patterns rather than just collecting data. Here is what heatmap studies of Kerala business websites consistently reveal:
Why Kerala Website Visitors Leave Without Converting
Why Kerala website visitors leave without converting is one of the most important questions any Kerala business owner can ask. Heatmap data from multiple regional websites reveals these common patterns:
— Trust signals such as awards, certifications, and client testimonials placed too low on the page get ignored because most visitors never scroll that far. — Contact forms with too many mandatory fields see high abandonment, especially on mobile devices. — Navigation menus with too many options create decision paralysis, causing visitors to leave without clicking anything meaningful. — Pages loading slowly on mobile networks — a critical issue in semi-urban Kerala areas — cause rage clicks and early exits.
Mobile User Behavior Heatmap for Kerala Audiences
Kerala has one of India’s highest smartphone penetration rates. Mobile user behavior heatmap for Kerala audiences consistently shows that mobile visitors scroll faster, click more impulsively, and abandon pages more quickly than desktop users. This means your mobile layout, button sizes, and content hierarchy must be optimized separately from your desktop experience.
Heatmap SEO Strategy and CRO for Kerala Businesses
Heatmap SEO strategy for Kerala service businesses works by connecting behavioral signals to search engine ranking factors. When visitors engage deeply with your content — scrolling far, clicking internal links, spending time on the page — search engines interpret these as positive quality signals.
Here is how Kerala website conversion rate optimization with heatmaps works in practice:
If your scroll map shows that 70% of visitors drop off before reaching your service packages section, you move that section higher. If your click map reveals that a decorative banner image is getting more clicks than your actual CTA button, you redesign the layout. These behavioral-driven changes reduce bounce rate, increase dwell time, and directly support better search rankings.
Heatmap vs Google Analytics for Kerala Website Insights
Heatmap vs Google Analytics for Kerala website insights is not a competition — it is a partnership. Google Analytics tells you what happened: 300 visitors, 65% bounce rate, 1 minute 20 seconds average session. Heatmaps tell you why it happened: your CTA button was invisible below the fold, your form had too many fields, and your mobile menu was too small to tap accurately. Use both tools together for maximum intelligence.
Understanding Kerala Online Shopper Behavior with Heat Maps
Understanding Kerala online shopper behavior with heat maps is especially valuable for e-commerce businesses. Kerala shoppers show strong preference for product images over text descriptions. They click on product photos expecting zoom features. They scroll to reviews before scrolling back up to add items to cart — a behavior pattern that suggests reviews should be placed closer to the purchase button.
For CRO tools for Kerala digital marketing agencies, heatmap data is also a powerful client reporting asset. It visually demonstrates where website improvements are needed and quantifies the impact of changes made — making it easier to communicate value to clients across industries.
Improve Kerala Website UX Using Heatmap Data — Action Steps
Improve Kerala website UX using heatmap data with these five practical actions:
- Run heatmaps on your top five traffic pages for a minimum of two weeks before drawing conclusions.
- Identify your fold line on both mobile and desktop — ensure your most critical content sits above it.
- Fix every rage-click element — buttons that do not work, images users expect to be interactive, and broken links.
- Redesign scroll-dead zones — sections where visitors consistently stop scrolling need stronger visual hooks or must be removed entirely.
- Combine heatmap findings with user behavior analytics for Kerala e-commerce websites to create a data-driven redesign roadmap with measurable conversion goals.
Conclusion — Turn Visitor Data into Business Growth
Kerala’s digital landscape is competitive, diverse, and rapidly evolving. Both domestic visitors from across the state and international visitors — NRIs, tourists, and global buyers — interact with your website in distinct ways. Website heatmap analysis for Kerala businesses gives you the behavioral intelligence to serve both audiences effectively.
Stop guessing what your visitors want. Start seeing exactly what they do.
If you are ready to unlock the full potential of your Kerala website through expert heatmap analysis, UX optimization, and data-driven digital marketing strategy, visit https://sanaledison.com/ today. Our team specializes in helping Kerala businesses grow online — locally and globally.